New York Temperature Archive
2022-07-20 16:01 - General
Years ago, in my second apartment in Brooklyn, I set up some temperature sensors with my home server in order to enable thermostat-like functionality. I logged the data and eventually expanded the window for how long the data is stored. I've moved out of New York, and it doesn't make sense to continue collecting the same data set.
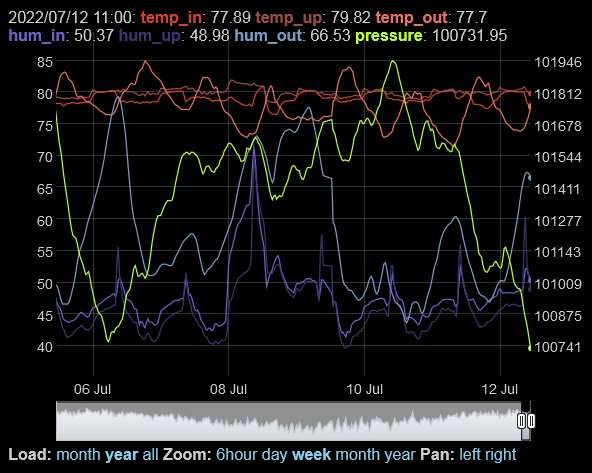
So I've saved the data and made a static archive of it. At first I had only temperature. Later I added humidity and barometric pressure. Click on the headers to remove the lines, somewhat necessary to make reading a graph over a large time window practical.
Turns out I "only" saved ten years of data. Automatically rotated out by RRDTool. The "temp_out" graph is probably the most generally interesting. Based on the time window, that's always just outside my apartment in Chelsea. The summer peaks are pretty consistent, but the winter troughs are clearly higher (~never below 20 F) than before that (usually below 15 or 10 F). Hmm.